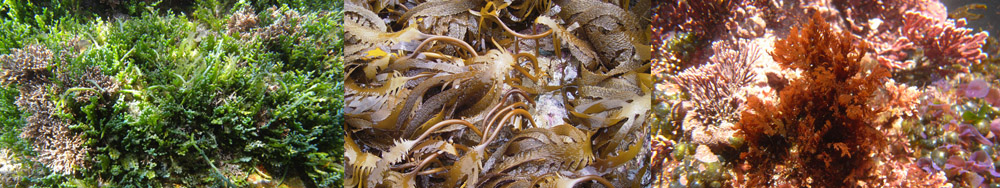
Seaweeds of the South African South Coast
| SEARCH BOX |
|
Choose operator: |
|
Enter keyword: |
|
|
![]()
![]()
![]()
![]()
![]()
![]()
We follow Bolton and Stegenga (2002) in dividing the coast of South Africa into 50 km sections for the purpose of plotting seaweed distributions: the south coast (Figure 1 and Table 1) falls between section 22 (Cape Agulhas area) and section 48 (Mzamba to Margate). Seaweed distributions are interpolated: that means that if a species is found for example in sections 35 and 37, it is assumed to also occur in section 36. However, for most species we also state the actual places at the extremes of their recorded ranges.
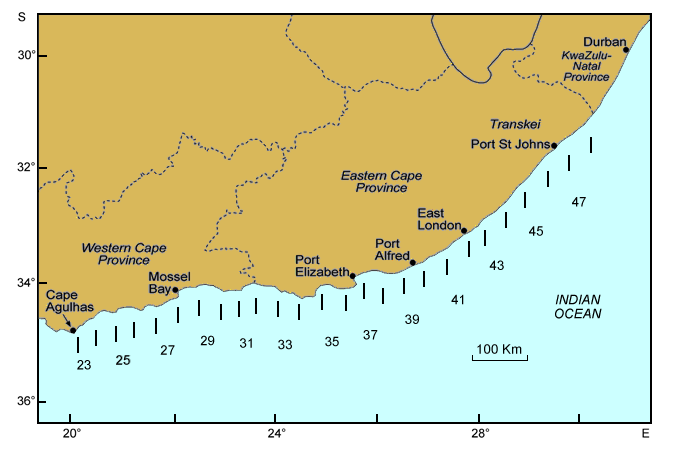
Figure 1a. The South African south coast, with every second 50 km section numbered. See Table 1 for boundaries.
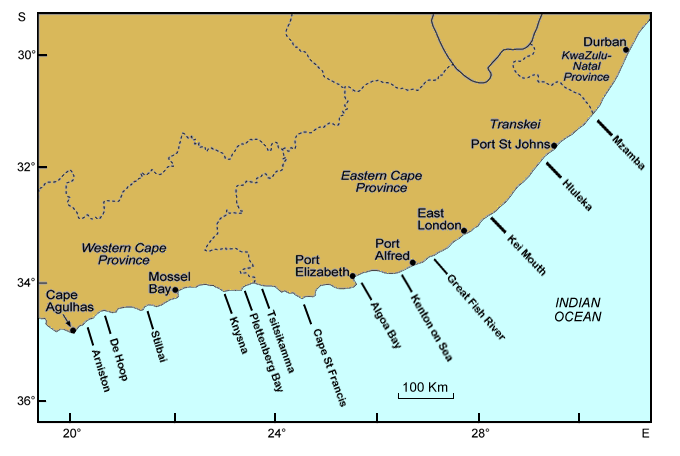
Figure 1b. The South African south coast, with place names commonly used in species distributions
Table 1. The 50 km long coastal sections used by Bolton & Stegenga (2002) that fall within the south coast, as defined in the present study. Numbers, with geographical coordinates, positions of boundaries relative to known places, and some well-known sites included in each section, as in Bolton & Stegenga (2002).
No. |
South |
East |
Boundaries |
Sites included |
|---|---|---|---|---|
23 |
20.47732 |
-34.49243 |
Struisbaai -Skipskop |
Struisbaai, Arniston |
24 |
20.87056 |
-34.38810 |
To just E of Cape Infanta |
Koppie Allen, Infanta, Witsand |
25 |
21.35563 |
-34.42480 |
To just E of Jongensfontein |
Puntjie, Skurwe Bay |
26 |
21.82968 |
-34.38157 |
To just W of Gouritzmond |
Stilbaai, Bloukrans, Bull Point |
27 |
22.11571 |
-34.15734 |
To just E of Mossel Bay |
Gouritzmond, Vleesbaai, |
28 |
22.53969 |
-34.01308 |
To just W of Victoria Bay |
Hartenbos, Grootbrak, Herolds Bay |
29 |
23.01642 |
-34.07989 |
To just W of Knysna Heads |
Victoria Bay, Wilderness, Walker Bay |
30 |
23.35867 |
-34.10201 |
To just W of Plettenberg Bay |
The Heads, Neusgate |
31 |
23.78027 |
-34.00998 |
To Elandsbos River |
Plettenberg Bay, Keurbooms, |
32 |
24.26944 |
-34.08458 |
To Skuinsklip |
Storms River, Voelkrans, Skietgate |
33 |
24.73894 |
-34.18988 |
To Thyspunt |
Tsitsikamma River, Klipdrif River |
34 |
25.03553 |
-34.97130 |
To just W of Gamtoos River |
Cape St Francis, Jeffreys Bay |
35 |
25.51952 |
-34.03581 |
To just E of Sardinia Bay |
Van Stadens River, Claasen Point |
36 |
25.69996 |
-33.79133 |
To just E of St Georges Beach |
Chelsea pt, Port Elizabeth, Bluewater |
37 |
26.17661 |
-33.72051 |
To just W of Woody Cape |
St Croix Is., Sundays River |
38 |
26.64813 |
-33.70001 |
To just W of Kenton-On-Sea |
Bird Is., Cape Padrone, Cannon Rocks |
39 |
27.10371 |
-33.52269 |
To just E of Kleinemonde |
Kasouga, Port Alfred |
40 |
27.51706 |
-33.26662 |
To just E of Keiskamma River |
Great Fish River, Madagascar Reef |
41 |
27.92591 |
-33.01227 |
To just E of East London |
Kayser's Beach, Cove Rock |
42 |
28.30072 |
-32.73128 |
To Haga-Haga |
Gonubie, Cintsa |
43 |
28.68348 |
-32.43986 |
To Qora River |
Morgan bay, Kei Mouth, Mazeppa Bay |
44 |
29.04811 |
-32.11370 |
To just E of Xora River |
Dwesa, The Haven |
45 |
29.37234 |
-31.76221 |
To Sharks Point |
Mncwasa river, Coffee bay, Hluleka |
46 |
29.74337 |
-31.46446 |
To Mkozi River |
Bolder Bay, Port St Johns, Montshe, Ntsubane |
47 |
30.12123 |
-31.17581 |
To Mnyameni River |
Cathedral Rock, Lambasi Bay, |
Coastal topography
The outline of the south coast was created during the fragmenting of Gondwanaland, which started some 135 million years ago. Rock types along the coast vary with geological history, and include sandstones, dolerites, shales and aeolianite (Marker, 1988). These vary in hardness and texture, and result in a variety of shapes of shores and of the rocks themselves, creating a corresponding variety of habitats for marine life in the inshore zone.
The rocky and sandy shores of South Africa were charted by Jackson & Lipschitz (1984) and a further but important shore-type (mixed shores of sand and rock) was quantified by Bally et al (1984). The south coast as we define it here displays varying coastal geology and topography and contains elements of all of these shore types.
From Cape Agulhas to Algoa Bay, rocky capes (e.g . Cape Agulhas, Cape Infanta, Cape St Blaize, Cape Seal, Cape Recife ) form exposed headlands that create half-heart bays on their eastern sides. Between these bays lie smaller headlands, stretches of sandy beach, and wave-cut platforms of hard rock or softer aeolianite (good examples of the last type are found at De Hoop and east of Stilbaai). This part of the coast has few, but relatively large rivers and estuaries. From Cape Padrone eastwards the pattern of half-heart bays is replaced by an undulating coastline with many small (and a few large) estuaries. East of Port Alfred the proportion of sandy shore falls: there are many stretches of wave-cut platform interspersed with small beaches. From East London eastwards the coast is dominated by relatively low wave-cut platforms interspersed with coarse-grained sandy beaches, with notable areas of rocky headland around Hole-in-the-Wall, Brazen Head, Port St Johns, and Waterfall Bluff. From there to the Umtamvuna River the coast comprises extensive wave-cut platforms with short stretches of coarse-grain sandy beaches.
Many of the small estuaries, particularly on the eastern part of this coast, are only open sporadically or seasonally, and estuaries probably have little influence on seawater salinity or the seaweeds along this coast. The Knysna Estuary is large enough to form a substantial habitat of its own, but has a relatively small catchment area and little influence on the outer coast.
Climate
The terrestrial climate ranges from temperate in the west to subtropical in the east, with a corresponding change in the seasonality of rainfall. Along the coast from Cape Agulhas to the Bushmans River area, rain falls mainly in winter, but also with peaks in spring and autumn, while from East London eastward most rain falls mainly in spring and autumn, with fairly high summer rainfall and little in winter. Low pressure systems that bring most of the rain to the Western Cape and southern part of the south coast tend to weaken by the time they reach the Port Elizabeth area.
This is a very windy coast, especially between Port Elizabeth and the East London area, and the winds strongly affect seawater temperatures, both on broad and very localized scales (see later).
Tides and waves
Tides along the South African coast are semi-diurnal (there are two low and two high tides per day), with a maximum range of about 2m during the spring tide periods. Tidal range peaks during spring tides, so that Low Water Spring tides (LWS) are the best times for collecting seaweeds in the intertidal zone.
The south coast is exposed to large and frequent swells that arrive mainly from the south west, but at times strong southerly and south east winds may produce large swells from those directions. Wave effects are reduced within bays, but in general this coast is very exposed.
Inshore sea temperatures and coastal currents
The single most important factor that controls the geographical distribution of most marine organisms is water temperature. This is because metabolic processes are controlled by temperature, and each species has a genetically determined range of temperatures within which it can live. Whether an organism can breed, thrive, or even just survive at a particular temperature is laid down in its genes. In the case of seaweeds, many studies have demonstrated the controlling effects of temperature on geographical range (e.g. Breeman 1988; Lüning 1990). For this reason we discuss seawater temperatures along the south coast in some detail.
While average seawater temperatures (for example, over a year) may sometimes be useful in explaining distributions, it is often the extremes and their durations that are more important. All of these are controlled by a number of factors that operate at various scales. For a recent account of inshore seawater temperatures around the coast of South Africa, see Smit et al. (2013).
Major ocean currents operate at the largest scale, and the south coast is overwhelmingly affected by one of the world’s greatest among these: the Agulhas Current. This powerful ocean current originates in the western Indian Ocean by the confluence of the Mozambique Current (flowing south between Mozambique and Madagascar) and the South Equatorial Current (flowing westwards below Madagascar, then turning south).
The Agulhas Current is one of the largest in the world, up to 100 km wide and 1000m deep, and reaching speeds of up to 3.5 m s-1. Its average surface temperature falls as it travels south-westwards along the south coast, from about 23oC off Port St Johns to about 20 oC off Cape Agulhas. However, although this current brings warm water to the coast as a whole, it runs along the edge of the continental shelf , which varies in its distance from the shore, and inshore water temperature are affected by other processes, the most important of which are various types of upwelling.
Upwelling describes the movement of water from deeper to shallower levels (usually to the surface) and invariably results in cooling of the surface water, simply because the deeper water is colder (cold water sinks) and also because shallow water has been heated by the sun. Deeper water usually contains more nutrients so that upwelling is often essential to sustain primary production of autotrophs in the inshore zone.
Several types of upwelling affect the south coast (Lutjeharms et al. 2000) and together they strongly affect the distribution and productivity of the seaweeds.
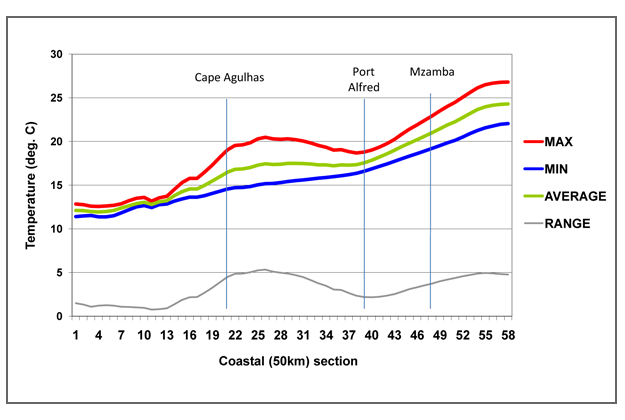
Figure2. Inshore seawater temperatures for each 50 km section of the South African coast (W to E). Data from in situ recorders and measurements, interpolated in some sections. Max and min are means of warmest and coldest months. (Smit, Anderson & Bolton, in prep.).
Nutrients
The two most important macro-nutrients for seaweeds are generally considered to be Nitrogen (N) and Phosphorus (P), and these and other macro-and micro-nutrients are mainly provided by the upwelling of cool, nutrient-rich water from the continental shelf or deeper. The nutrients come mainly from decomposed organisms that have sunk down to the sea-floor, although riverine sediments also contribute organic matter that is ultimately upwelled in the form of inorganic nutrients.
Nutrient levels vary temporally and spatially in inshore waters of the south coast, and in general are probably inversely related to water temperature, as shown for the Benguela system (Waldron & Probyn 2010). There, temperatures below about 16 oC usually indicate moderate to high nutrient levels, while those above 18 oC indicate low or limiting levels. Water temperature can thus serve as a general indicator of nutrient availability.
References
Bally, R., McQuaid, C.D. & Brown, A.C. 1984. Shores of mixed sand and rock: an unexplored marine ecosystem. South African Journal of Science, 80: 500-503.
Bolton J.J. & Stegenga, H. (2002) Seaweed biodiversity in South Africa. South African Journal of Marine Science, 24, 9-18.
Breeman, A.M. (1988) Relative importance of temperature and other factors in determining geographic boundaries of seaweeds: experimental and phenological evidence. Helgolanders Meeresuntersuchungen, 42, 199-241.
Jackson, L.F & S. Lipschitz. 1984. Coastal Sensitivity Atlas of Southern Africa. Cape Town, Government Printer. 34 charts.
Lüning, K. (1990) Seaweeds: their environment, biogeography and ecophysiology. Wiley, New York.
Lutjeharms, J.R.E., Cooper, J. & M.Roberts. 2000. Upwelling at the edge of the Agulhas Current. Continental Shelf Research 20: 737-761.
Marker, M.E. 1988. Geology and geomorphology. In: Lubke, R.A., Gess, F.W. & M.N.Bruton (Eds). A Field Guide to the Eastern Cape Coast. Wildlife Society of Southern Africa, Grahamstown, pp. 9-18.
Smit AJ, Roberts M, Anderson RJ, Dufois F, Dudley SFJ, et al. (2013) A Coastal Seawater Temperature Dataset for Biogeographical Studies: Large Biases between In Situ and Remotely-Sensed Data Sets around the Coast of South Africa. PLoS ONE 8(12): e81944. DOI:10.1371/journal.pone.0081944.
Waldron, H.N. & Probyn T.A. 2010. Nitrate supply and potential new production in the Benguela upwelling system. South African Journal of Marine Science 12: 29-39.
Citing this publication:
Anderson RJ, Stegenga H, Bolton JJ. 2016. Seaweeds of the South African South Coast.
World Wide Web electronic publication, University of Cape Town, http://southafrseaweeds.uct.ac.za; Accessed on 19 April 2026